You sent the email. You watched the send confirmation pop up. Then you waited. Did anyone actually read it? Or did it vanish into the digital void of the "Promotions" tab?
This is where Email Marketing Analytics becomes your compass. It’s not just about vanity metrics; it’s about understanding human behavior at scale. Two numbers dominate this landscape: Open Rate and Click-Through Rate (CTR). They tell different stories. One says, "I looked." The other says, "I acted." Confusing them leads to bad decisions. Mixing them up means wasting budget on subject lines that don’t convert or landing pages that bore people.
The Privacy Shift That Broke Open Rates
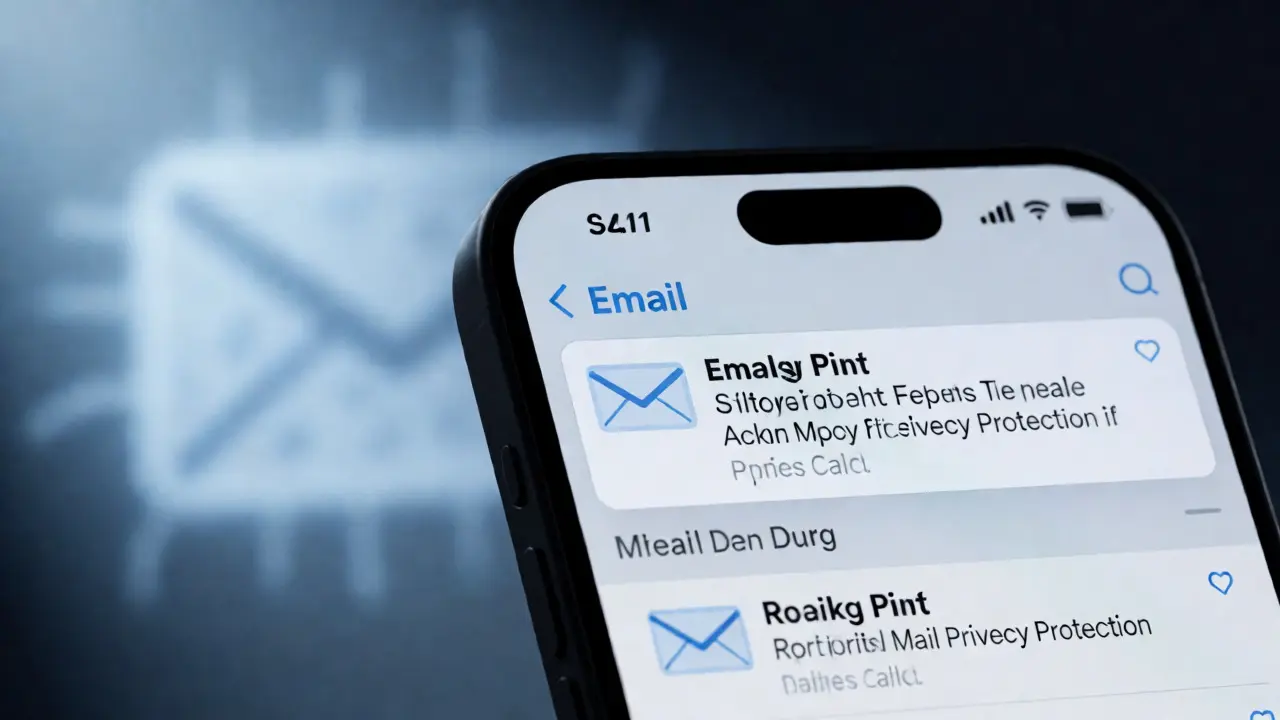
Here’s a hard truth: Your open rate data is likely lying to you. For years, marketers relied on tracking pixels-tiny invisible images loaded when an email opened-to count opens. But in 2021, Apple introduced Mail Privacy Protection. This feature pre-fetches emails, loading those pixels even if the user never glances at their inbox.
The result? Open rates inflated by 20% to 40% for many industries. If you’re seeing 60%+ open rates today, ask yourself: Is my audience obsessed with my content, or are they using iPhones? Mail Privacy Protection makes open rates less reliable as a standalone metric. So, what do we do? We stop treating opens as gospel. Instead, we use them as directional indicators combined with other signals like deliverability and list health.
If you’re still judging campaigns solely on opens, you’re driving blindfolded. Focus shifts to actions taken inside the email. That brings us to the second key metric.
Why Click-Through Rates Are the Real Currency
Click-Through Rate (CTR) measures how many recipients clicked at least one link in your email. Unlike opens, clicks are harder to fake. A privacy proxy won’t click your "Buy Now" button. CTR proves intent. It shows someone cared enough to move from passive reading to active engagement.
But here’s the catch: CTR is sensitive to design and copy. A single weak call-to-action (CTA) can tank your numbers. If your open rate is high but CTR is low, your subject line promised something your body copy didn’t deliver. It’s a bait-and-switch problem. Conversely, if opens are low but CTR is sky-high, your targeting is spot-on, but your subject line needs work.
Don’t ignore Unique Clicks vs. Total Clicks. Unique clicks count each person once, no matter how many links they hit. Total clicks count every action. Use unique clicks for conversion analysis. Use total clicks to gauge content depth. If people are clicking multiple links, your email is rich with value. If they click only one, keep your message focused.
Benchmarks That Actually Matter
Stop comparing your stats to global averages. They’re useless. A B2B SaaS company sending newsletters will have different norms than an e-commerce brand running flash sales. Context is king.
| Industry | Avg. Open Rate | Avg. CTR | Primary Goal |
|---|---|---|---|
| E-commerce | 38% | 2.5% | Immediate Purchase |
| SaaS / Tech | 42% | 1.8% | Feature Adoption |
| Non-Profit | 45% | 3.1% | Donations/Volunteering |
| Retail | 35% | 2.2% | Foot Traffic/Sales |
Notice the trend? Non-profits often see higher engagement because their audience feels emotionally connected. E-commerce sees lower opens because people expect promos, so they skim faster. Use these ranges to set realistic KPIs. If you’re below the bottom quartile, audit your list hygiene. If you’re above, test new creative angles.

Diagnosing Your Funnel: Where Are You Losing People?
Analytics isn’t just reporting; it’s diagnosis. Break down your funnel step-by-step:
- Deliverability: Did the email land in the inbox? Check bounce rates. Anything above 2% is a red flag.
- Engagement: Did they open? Look at trends over time, not single sends.
- Action: Did they click? Segment by device. Mobile users might open more but click less due to thumb fatigue.
- Conversion: Did they buy/sign-up? This happens outside the email, tracked via UTM parameters.
A common mistake? Ignoring the "Unsubscribe" rate. If 1% of your list unsubscribes after one email, your content is off-target. High opens + high unsubscribes = annoying frequency or irrelevant topics. Low opens + low unsubscribes = invisible sender. You need to fix visibility first.
How to Improve Both Metrics Simultaneously
You want both high opens and high clicks. Here’s how to hack the system without cheating:
For Opens: Test subject lines ruthlessly. Use A/B testing tools in platforms like Mailchimp or Klaviyo. Try curiosity gaps ("You missed this") vs. direct benefits ("Save 20% today"). Personalization helps, but only if you have real data. "Hi [First Name]" is basic. "Hi Jamie, your Portland order shipped" is powerful.
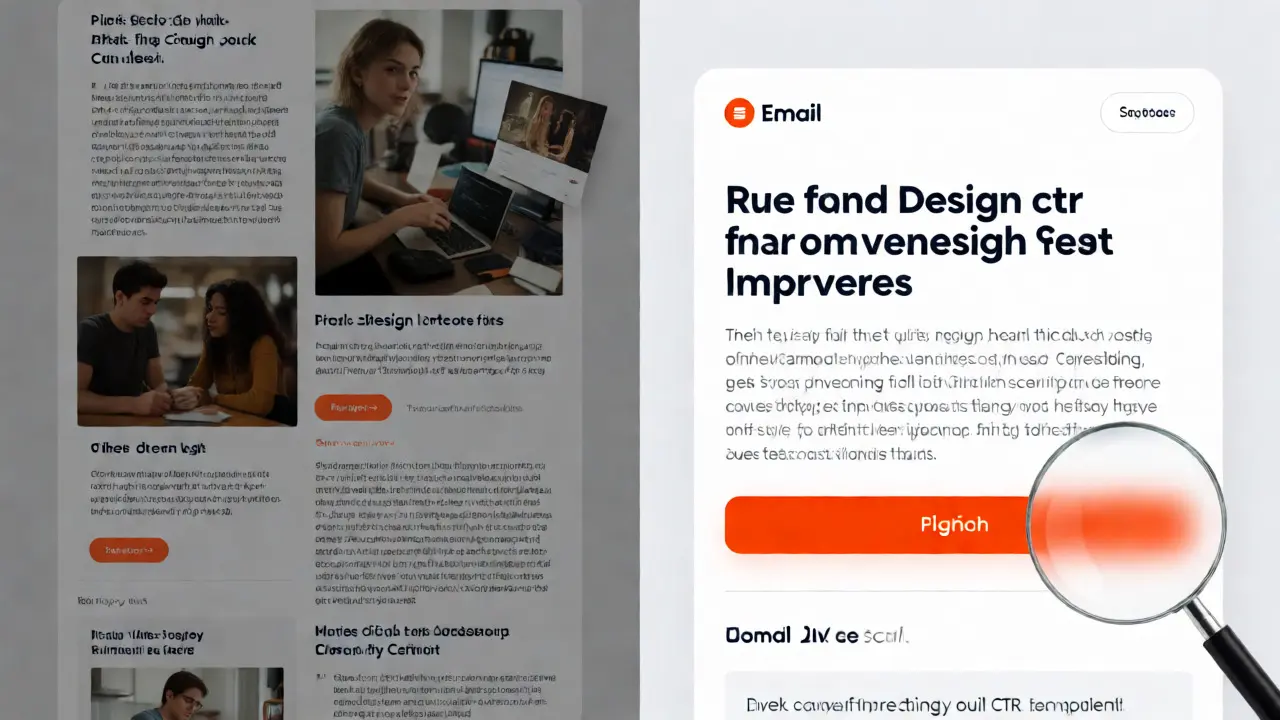
For Clicks: Design for scanning. Most people read 20% of your words. Use bold headers, short paragraphs, and clear CTAs. Place primary links above the fold. Use contrasting colors for buttons. And please, avoid image-only emails. Many clients block images by default. If your entire pitch is in a JPG, you’ve lost the click.
One pro tip: Send timing matters less than consistency. Tuesday through Thursday mornings generally perform best for B2B. Evenings work better for consumer retail. But your audience decides. Check your ESP’s heat map feature to see when *your* subscribers engage.
The Role of Segmentation in Accuracy
Blast emails skew analytics. If you send one message to everyone, your average open rate hides the truth. Maybe loyal customers open 70% of the time, while inactive ones open 10%. Averaging them gives you 40%, which tells you nothing actionable.
Segment your list based on behavior:
- Active Users: Opened/clicked in last 90 days. Treat them VIP-style.
- Cold Leads: Haven’t engaged in 6 months. Send re-engagement campaigns or prune them.
- New Subscribers: First 30 days. Nurture them with welcome series.
When you segment, your metrics become honest. You’ll see higher CTRs for active segments because relevance drives action. Don’t be afraid to delete cold contacts. A smaller, engaged list outperforms a massive, dead one every time.
Advanced Tracking: Beyond Basic Counts
Once you master basics, dig deeper. Track Revenue Per Email. Divide total revenue generated by number of emails sent. This ties analytics directly to ROI. If a campaign has low CTR but high revenue per email, it’s worth keeping. If it has high CTR but zero sales, fix your landing page.
Also, monitor spam complaint rates. Above 0.1% risks hitting Gmail’s bulk folder. This kills future open rates silently. Keep complaints low by ensuring easy unsubscribe options and honoring opt-in promises.
Are open rates still relevant in 2026?
Yes, but with caveats. Due to privacy features like Apple Mail Privacy Protection, open rates are inflated and less accurate. Use them as a secondary metric alongside clicks and conversions. Focus on relative changes over time rather than absolute values.
What is a good click-through rate for email?
A good CTR typically ranges between 2% and 5% for most industries. However, niche audiences or highly targeted segments may see rates above 10%. Always compare against your own historical data and industry-specific benchmarks rather than generic averages.
How do I calculate unique click-through rate?
Divide the number of unique recipients who clicked at least one link by the number of delivered emails, then multiply by 100. Formula: (Unique Clicks / Delivered Emails) x 100 = Unique CTR %. This prevents one hyper-active user from skewing your performance data.
Why is my open rate high but click rate low?
This usually indicates a disconnect between your subject line and email content. The subject line attracted attention, but the body copy failed to provide a compelling reason to act. Review your call-to-action clarity, mobile responsiveness, and content relevance.
Does sending time affect click-through rates?
Yes, timing influences engagement. Sending during working hours often boosts B2B clicks, while evenings and weekends may improve B2C interaction. However, consistent scheduling builds habit. Use your email service provider's analytics to find when your specific audience is most active.