When we talk about data storytelling for musicians is the practice of translating raw streaming and social metrics into actionable narratives that help artists make better creative and business decisions. It is the difference between saying "I got 10,000 streams" and saying "My lead single is resonating with Gen-Z listeners in urban hubs, but they're dropping off after 30 seconds, meaning I need a shorter intro." The first is a vanity metric; the second is a roadmap for your next release.
The Gap Between Data and Insight
Most artists suffer from 'metric overload.' You have access to Spotify for Artists, Apple Music for Artists, and YouTube Studio. These tools give you the 'what,' but they rarely give you the 'why.' For example, if your skip rate is high on a specific track, the data tells you people are leaving. The story tells you that your transition from the intro to the chorus is too slow for today's shorter attention spans.
To move from raw data to a narrative, you need to look for patterns. If you notice that your listeners in Berlin are consistently higher than in your hometown, that's not just a stat. That's a signal. It tells you that your sound fits the current electronic scene in Germany. Instead of wasting your ad budget on a broad global campaign, you can now tell a story: "My music is finding a home in the Berlin club scene, so I'll target my Instagram ads specifically to that region and look for local promoters there."
Mapping the Fan Journey with Analytics
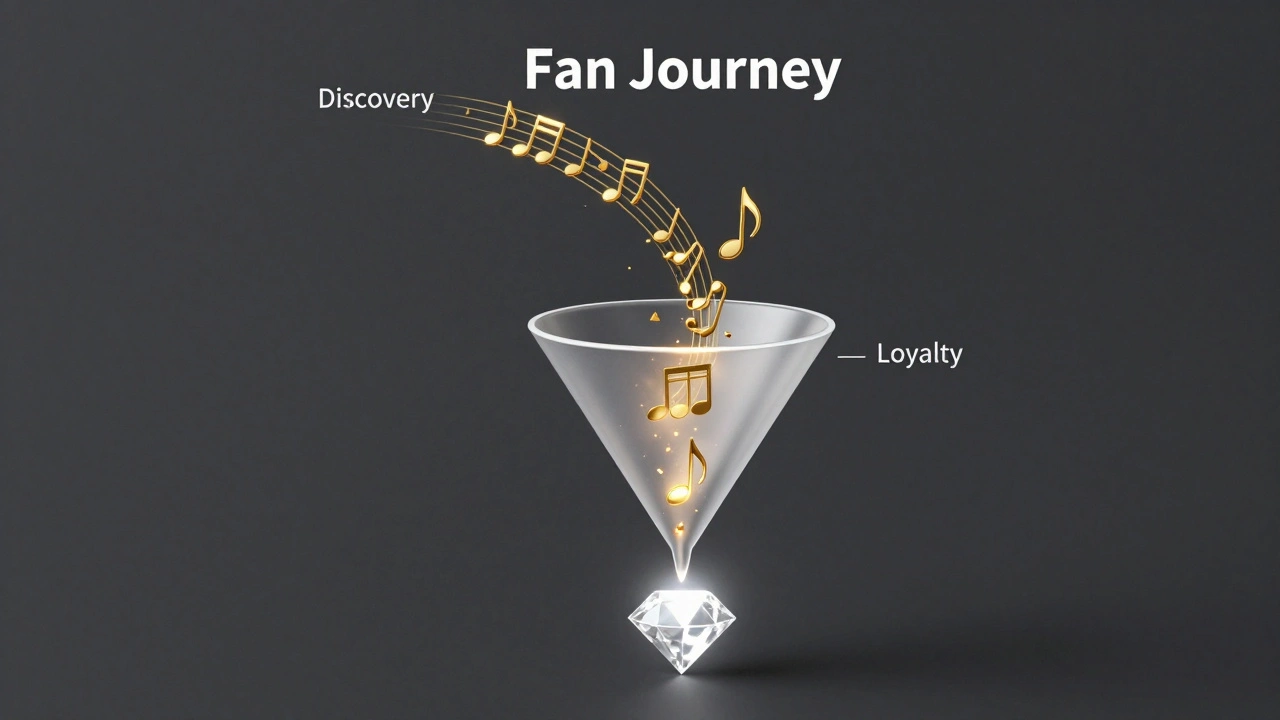
Think of your release as a funnel. A fan doesn't just appear in your monthly listeners; they go through a journey. Using Release Analytics, you can map this path. It usually looks like this: Discovery → Engagement → Loyalty.
- Discovery: This is where Algorithmic Playlists like Discover Weekly or Release Radar come in. If your "Listeners" count is huge but your "Followers" count is stagnant, you have a discovery success but an engagement failure. The story here is: "People like the song, but they don't care about the artist yet."
- Engagement: Look at your save rate. A save is a conscious decision. If 5% of people who hear your song save it, you've moved them from a casual listener to a fan.
- Loyalty: This is measured by repeat listeners. If the same people are coming back to your track every day for a month, you've built a narrative of necessity-your music has become part of their daily routine.
| The Raw Metric (Data) | The Interpretation (Story) | The Actionable Step |
|---|---|---|
| High Skip Rate at 0:15 | The intro isn't hooking the listener quickly enough. | Edit the next track for a faster payoff. |
| Spike in listeners from a specific city | Localized cultural trend or a specific local playlist. | Target geo-specific ads to that city. |
| High Save-to-Stream Ratio | The song has high "replay value" and emotional impact. | Use this track as the primary ad creative. |
| Low Follower Growth despite high streams | The music is good, but the brand/persona is invisible. | Increase short-form video content on TikTok. |
Turning Streaming Data into Tour Routes
One of the most practical applications of data storytelling is planning live shows. Many artists book tours based on where they *want* to go, which is a recipe for playing to empty rooms. Instead, use your Geographic Data to build a narrative of demand.
Imagine your dashboard shows a heat map with a bright red dot in Chicago and a pale yellow one in New York. The data says "Chicago > New York." The story is: "I have a concentrated pocket of superfans in the Midwest who are underserved." This allows you to approach a venue in Chicago with actual proof of demand. You aren't just asking for a slot; you're presenting a case: "I have 2,000 monthly listeners in this zip code who are actively saving my latest single." That's a narrative a promoter can actually buy into.
The Psychology of the 'Saves' Metric
Let's talk about the most underrated metric in modern music: the save. In the era of Streaming Services, a stream is passive. Someone could be cleaning their house and your song just happens to play in a curated mood playlist. But a save is an active intent. It's a user saying, "I want to find this again."
If you analyze the relationship between streams and saves, you can find the "True Fan Ratio." If you have 100,000 streams but only 100 saves, your song is likely a "background track"-it's pleasant, but not memorable. However, if you have 5,000 streams and 500 saves, you have a high-intensity connection. This tells you that your music is provoking a strong emotional response. When you see this, the narrative changes from "growing the reach" to "deepening the connection." You stop worrying about the total number of plays and start focusing on building a community around that specific emotional trigger.
Using Data to Refine Your Creative Process
Data storytelling isn't just for the marketing side; it should leak into your studio time. While some purists hate the idea of "letting numbers dictate art," there is a middle ground. You can use Retention Graphs (found in YouTube Studio or similar tools) to see exactly where people lose interest.
If you see a massive cliff-drop during a two-minute bridge, you've learned something about your audience's patience. Does that mean you should always write short bridges? No. But it does mean you can ask *why* it's happening. Maybe the bridge lacks a melodic hook, or maybe the energy shift is too abrupt. By treating the retention graph as a storytelling tool, you can make more informed decisions about your arrangements without sacrificing your artistic integrity. You're not changing the art to please the algorithm; you're refining the delivery to ensure the art is actually heard.

Avoiding the Vanity Metric Trap
The biggest mistake musicians make is chasing "The Big Number." Millions of streams feel great, but they can be a lie. If those streams come from a "Sleep Music" playlist and the listeners aren't following you, saving your songs, or visiting your website, you aren't building a career-you're just providing audio wallpaper for people to nap to. This is the "Vanity Metric Trap."
A data-driven narrative focuses on conversion. The story you want to tell is how a listener moves through your ecosystem:
Playlist Stream → Profile Visit → Follow → Email Sign-up → Ticket Purchase.
If you can identify where the leak is in that pipeline, you can fix it. If people are visiting your profile but not following, your bio or imagery might be the problem. If they follow but don't sign up for your newsletter, your call-to-action is too weak. Each step is a chapter in the fan's story with you.
What is the most important metric for a new artist?
While total streams look good on a press kit, the "Save Rate" (Saves divided by Unique Listeners) is the most critical for growth. It indicates whether your music is actually resonating or just being played passively. A high save rate suggests the song has a high probability of being picked up by the algorithm for wider distribution.
How often should I analyze my release data?
Avoid checking daily; you'll drive yourself crazy with minor fluctuations. Instead, perform a "Deep Dive" every 14 days. This gives the streaming algorithms enough time to categorize your song and provide a statistically significant sample of listener behavior.
Does a high skip rate always mean the song is bad?
Not necessarily. Skip rates are often higher on the first 30 seconds of a song because listeners are quickly auditing a new track in a playlist. If the skip rate stabilizes after the 30-second mark, it means those who stay are highly engaged. The problem only exists if the skip rate remains high throughout the entire track.
How do I use data to get on more playlists?
Playlisters look for "proof of concept." Use your data to show that your song is already performing well in a specific niche. For example, if your data shows high engagement from listeners who also like a specific mid-tier artist, mention that in your pitch. It proves there is an existing audience for your sound.
Can data storytelling help with songwriting?
Yes, by analyzing retention graphs and skip rates across multiple releases. If you notice a recurring pattern where listeners drop off during long instrumental sections, you can experiment with adding more vocal hooks or shortening those sections in future songs to keep the narrative moving.
Next Steps for Your Data Strategy
If you're feeling overwhelmed, start small. Pick one release and one specific question you want to answer. Don't ask "How is my song doing?" Instead, ask "Who is the most engaged person listening to this song, and where do they live?" Once you find that answer, build a strategy around it.
For those with a growing catalog, try A/B testing your cover art. Run two different sets of ads with different visuals leading to the same song. The data will tell you which image evokes the right emotion for the track. The winning image isn't just the one with more clicks-it's the one that leads to more saves. That's how you turn a set of numbers into a visual and sonic narrative that actually grows your career.