When you release a new podcast episode, you probably care about how many people listened. But numbers alone don’t tell the whole story. What if you knew exactly where those listeners were sitting when they hit play? That’s where geographic data comes in - and it’s one of the most powerful, underused tools in podcast analytics.
Why Location Matters More Than You Think
Most podcasters think their audience is spread evenly across the country. But that’s rarely true. The data shows something else: listeners cluster. A lot of them are in just a few cities or regions. If you’re releasing content about local events, regional slang, or culturally specific topics, knowing where your audience lives helps you tailor what comes next.
Take a true crime podcast that started in Austin, Texas. After six months, the analytics showed 38% of its listeners were in Texas, with another 22% in neighboring Oklahoma and Louisiana. That wasn’t a coincidence. The host started weaving in Texas-specific case studies, interviewing local investigators, and even referencing regional weather patterns during cold cases. Downloads jumped 42% in the next quarter. Why? Because listeners felt seen.
Location isn’t just about where people are - it’s about what they care about based on where they are.
How Geographic Data Is Collected
Podcast platforms don’t track your listeners’ exact addresses. That’s not how privacy works. Instead, they use IP addresses, device location settings (if enabled), and regional DNS data to estimate location at the city or state level. Most platforms, like Spotify, Apple Podcasts, and Anchor, give you this data in aggregated form - meaning you see totals per country, state, or metro area, not individual names.
Here’s what you’ll typically see in your analytics dashboard:
- Top 10 countries where listeners tune in
- Top 10 U.S. states (or provinces, if outside the U.S.)
- Top 5 metropolitan areas (like Chicago, Atlanta, or Seattle)
- Percentage of listeners from urban vs. rural areas
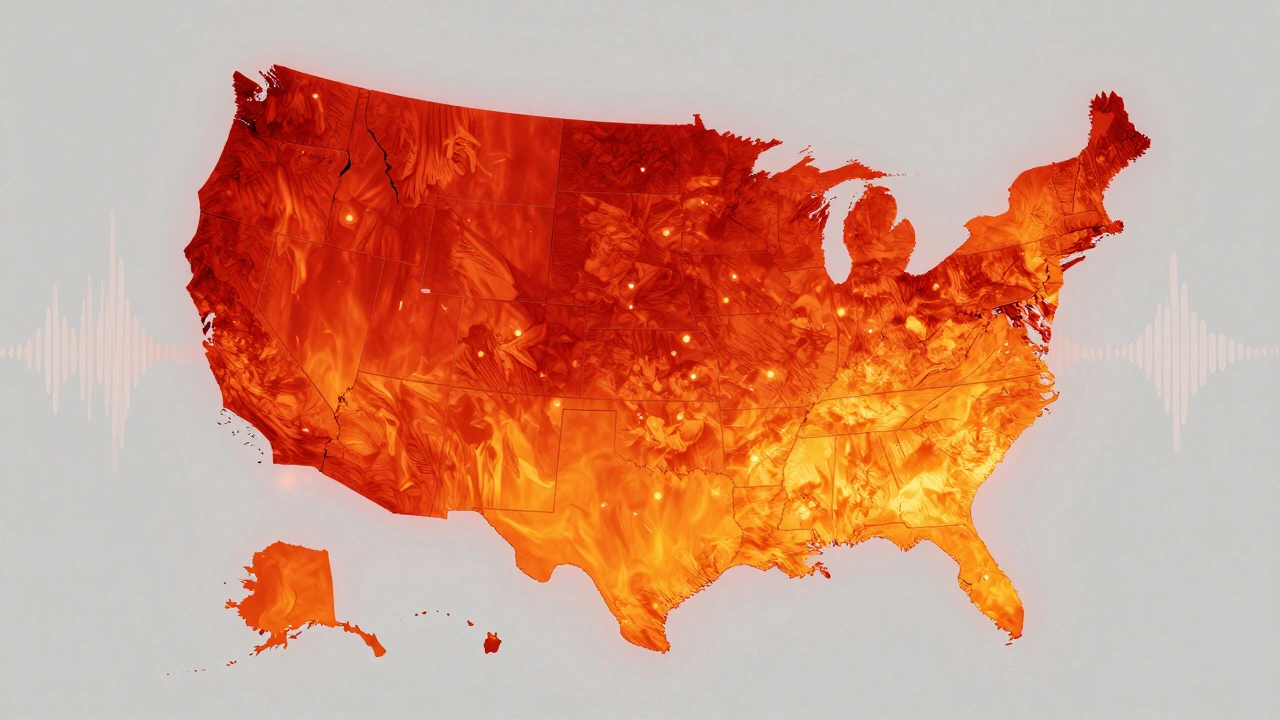
Some platforms even show heat maps - color-coded maps that show density of listens. Dark red means heavy listening. Light yellow means sparse. These visuals make patterns obvious at a glance.
What Your Map Is Telling You
Let’s say your podcast about urban gardening gets 80% of its listens from California, New York, and Washington. That’s not random. Those states have high rates of apartment living, strong environmental policies, and a culture of DIY home projects. You’re not just reaching gardeners - you’re reaching people who live in places where space is limited and community gardens are common.
Another example: A history podcast focused on the Civil War saw 61% of its listens from the American South. That didn’t mean the audience was biased - it meant those listeners were deeply connected to the subject. The host started releasing bonus episodes on lesser-known battlefields in Georgia and Alabama, and engagement soared. Listeners didn’t just want facts - they wanted stories that mirrored their own backyards.
On the flip side, if your audience is mostly concentrated in one area, you might be missing out on broader appeal. A language-learning podcast with 90% of its listeners in Canada might be overlooking the huge English-speaking market in Australia, the UK, or even parts of Asia. Geographic data doesn’t just confirm your current audience - it shows you where to grow.
Turning Data Into Action
So what do you do with this info? Here’s how to turn location data into real decisions:
- Adjust episode topics. If most listeners are in the Midwest, talk about seasonal weather patterns, local farming trends, or regional history. Don’t assume everyone relates to coastal culture.
- Time your releases. Listeners in the Eastern Time Zone often tune in during morning commutes. Those in the Pacific Time Zone might listen after work. If your analytics show a spike at 7 p.m. PT, schedule your next episode to drop at 6 a.m. ET - that’s when it’ll hit their morning routine.
- Collaborate locally. Invite guests from your top-listening regions. A podcaster in Portland who noticed heavy listening in Seattle started co-hosting a monthly episode with a local botanist. That episode became their most-shared ever.
- Run targeted promotions. If 40% of your listeners are in Texas, consider partnering with a local coffee shop or bookstore for a listener meetup. Physical events build loyalty faster than digital ads.
- Test regional language. One cooking podcast noticed listeners in Louisiana engaged more with episodes that used Cajun phrases. They started adding those terms naturally - and retention went up.
What Your Data Isn’t Telling You
Geographic data is powerful, but it’s not magic. It won’t tell you why someone listened - just where. A listener in New York might be a first-generation immigrant from Bangladesh, or a retired teacher who moved there last year. You won’t know their background from a map.
That’s why you still need other data: listener retention rates, episode completion, and feedback. Use geography to guide your direction, not define your content. Don’t assume everyone in Ohio thinks the same way. Diversity exists within regions.
Also, don’t ignore the outliers. Sometimes, the smallest group - say, 2% of listeners in Alaska - gives you your most passionate comments. Those listeners might be your superfans. Reach out to them. Thank them. They’ll become your loudest advocates.

Tools to See Your Listener Map
Most podcast hosts get geographic data through their hosting platform. Here’s what to check:
- Spotify for Podcasters: Shows country and city-level data with a visual map. Updates weekly.
- Apple Podcasts Connect: Provides state and country breakdowns. Best for U.S.-based shows.
- Anchor (by Spotify): Includes heat maps and top 10 locations. Easy to read for beginners.
- Buzzsprout: Offers downloadable CSV files so you can analyze location data in Excel or Google Sheets.
- Transistor: Lets you filter listens by region and compare trends over time.
None of these tools give you personal info - and they shouldn’t. But together, they paint a clear picture of where your voice is being heard.
What to Do Next
Open your podcast analytics right now. Look at the map. Find your top three locations. Ask yourself:
- Do my last three episodes reflect the culture or interests of those places?
- Could I invite someone from one of those cities to appear on the show?
- Is there a local event, holiday, or trend I could tie into my next episode?
One change can make a big difference. A podcast about mental health noticed 30% of its listeners were in Florida. They didn’t know Florida had one of the highest rates of seasonal depression in the U.S. So they released a special episode on coping with winter-like gloom in a sunny state. It got shared 1,200 times.
Geographic data doesn’t just show you where your listeners are. It shows you where your connection to them is strongest - and where you can deepen it.
Can I see exact addresses of my podcast listeners?
No. Podcast platforms protect listener privacy and only provide location data at the city, state, or country level. No personal information like street addresses, names, or phone numbers is ever shared.
Why does my podcast have listeners in countries I didn’t expect?
Podcasts are global by nature. Someone in Japan might be learning English through your show. A listener in Germany might be researching your topic for academic work. Even if your content feels local, the internet makes it accessible worldwide. That’s a good thing - it means your message is reaching beyond your bubble.
How often should I check my geographic data?
Check it every time you release a new episode. Trends shift quickly. A topic tied to a local event (like a festival or election) might spike interest in one region for a week. If you wait too long, you’ll miss the chance to respond. Make it part of your post-release routine.
Does geographic data affect how podcasts are recommended?
Yes. Platforms like Spotify and Apple use location data to suggest podcasts to users in the same area. If your show is popular in Chicago, it’s more likely to show up in recommendations for other Chicago listeners. That’s why understanding your top regions can help you grow organically.
Can I target ads based on listener location?
You can’t target ads directly through podcast platforms, but you can use the data to guide your sponsorships. If most of your listeners are in Texas, pitch local businesses there. If your audience is spread across Canada and the U.S., look for national brands that align with your content. Location data helps you make smarter sponsorship choices.